
텍스트 빈도 분석을 위한 워드 클라우드(영문) - wordcloud, matplotlib
들어가며
워드클라우드는 텍스트 데이터에 존재하는 단어의 빈도에 따라 크기별로 시각화합니다. 한 눈에 데이터의 전반적인 상태를 파악할 수 있다는 장점이 있습니다. 이 글에서는 파이썬으로 워드클라우드를 생성하고, 특정 단어를 제외하거나 커스터마이징하는 방법을 소개합니다.
이 글에서 활용할 데이터는 캐글의 스포티파이 이용자 리뷰 데이터 셋입니다. 아래 링크에서 다운로드 받을 수 있습니다.
Spotify User Reviews
Exploring Positive and Negative Feedback from Real Users to Uncover Key Insights
www.kaggle.com
- 워드클라우드 생성
- 특정 단어를 제외한 워드클라우드 생성
- 전체 코드
워드클라우드 생성
먼저 필요한 패키지인 pandas, wordcloud, matplotlib을 import 합니다.
import pandas as pd
from wordcloud import WordCloud, STOPWORDS
import matplotlib.pyplot as plt
스포티파이 이용자 리뷰 데이터를 불러옵니다. 데이터는 Review와 label 2가지 컬럼으로 구성되어 있으며, 각각의 리뷰에 대해 긍정 혹은 부정으로 분류되어 있습니다.
df = pd.read_csv('DATASET.csv')
df.head()
워드클라우드를 POSITIVE(긍정)과 NEGATIVE(부정)으로 나누어 생성하겠습니다. '긍정'으로 필터링 후 전체 텍스트를 하나의 문자열로 결합합니다.
df_pos = df[df.label == 'POSITIVE'] # 긍정

text = " ".join(df_pos['Review'].astype(str)) # 문자열 결합
위의 text 변수와 wordcloud 패키지를 활용하여 워드클라우드를 생성합니다. 옵션은 크기를 설정하는 width, height와 배경 색상만 흰색으로 설정했습니다.
wordcloud = WordCloud(width=800, height=400, background_color='white').generate(text)생성한 wordcloud 변수를 matplotlib을 활용하여 시각화하겠습니다. figsize로 크기를 정하고, imshow로 wordcloud를 이미지로 표시합니다. 여기서, interpolation='bilinear'는 이미지의 품질을 개선하는 옵션입니다. 그리고 축을 제거하는 코드를 추가하면 스포티파이 이용자의 긍정 리뷰에 대한 워드클라우드를 확인할 수 있습니다.
plt.figure(figsize=(10, 5))
plt.imshow(wordcloud, interpolation='bilinear')
plt.axis("off")
plt.show()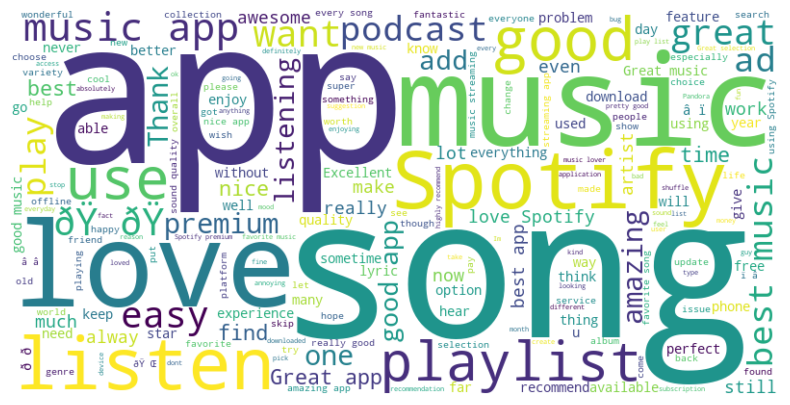
위와 동일한 과정으로 스포티파이 이용자의 부정 리뷰에 대한 워드클라우드는 다음과 같습니다.
df_neg = df[df.label == 'NEGATIVE'] # 부정

text = " ".join(df_neg['Review'].astype(str)) # 문자열 결합

wordcloud = WordCloud(width=800, height=400, background_color='white').generate(text)

plt.figure(figsize=(10, 5))
plt.imshow(wordcloud, interpolation='bilinear')
plt.axis("off")
plt.show()
특정 단어를 제외한 워드클라우드 생성
위에서 리뷰의 감정에 따라 분류된 긍정, 부정으로 워드클라우드를 생성했지만 [song, app, Spotify]와 같은 단어들 때문에 결과가 비슷해보입니다. 따라서, 특정 단어를 제외하고 다시 워드클라우드를 생성해보겠습니다.
워드클라우드를 생성하는 과정은 동일하며 stopwords 옵션만 추가하면 됩니다. 특정 단어는 임의로 지정하여 rm_words로 저장하고, stopwords 옵션으로 불러옵니다.
df = pd.read_csv('DATASET.csv')

df_pos = df[df.label == 'POSITIVE']
df_neg = df[df.label == 'NEGATIVE']

text_pos = " ".join(df_pos['Review'].astype(str))
text_neg = " ".join(df_neg['Review'].astype(str))

# 특정 단어 제외
rm_words = set(STOPWORDS)
rm_words.update(['music', 'app', 'song', 'songs', 'listen', 'Spotify'])

wordcloud_pos = WordCloud(width=800,
                          height=400,
                          background_color='white',
                          stopwords=rm_words).generate(text_pos)

wordcloud_neg = WordCloud(width=800,
                          height=400,
                          background_color='black',
                          stopwords=rm_words).generate(text_neg)

fig, axes = plt.subplots(1, 2, figsize=(20, 10))
fig.subplots_adjust(wspace=0)

# 긍정 워드클라우드
axes[0].imshow(wordcloud_pos, interpolation='bilinear')
axes[0].axis("off")
axes[0].set_title('Positive Reviews', fontsize=20, fontweight='bold')

# 부정 워드클라우드
axes[1].imshow(wordcloud_neg, interpolation='bilinear')
axes[1].axis("off")
axes[1].set_title('Negative Reviews', fontsize=20, fontweight='bold')

plt.axis("off")
plt.show()
긍정, 부정 리뷰에 대한 워드클라우드 시각화 결과, 추가 분석이 필요하겠지만 playlist에 대한 호불호와 ad(광고)에 대한 부정적인 의견을 확인할 수 있습니다. 이와 같이, 워드클라우드를 통해 텍스트 데이터의 전체적인 특성을 확인할 수 있습니다.
전체 코드
import pandas as pd
from wordcloud import WordCloud, STOPWORDS
import matplotlib.pyplot as plt

# --------------------------------------------------------------------------------- */

## 스포티파이 리뷰 데이터

df = pd.read_csv('DATASET.csv')
df.head()


# --------------------------------------------------------------------------------- */

## 워드클라우드 - 긍정

df_pos = df[df.label == 'POSITIVE'] # 긍정

text = " ".join(df_pos['Review'].astype(str)) # 문자열 결합

wordcloud = WordCloud(width=800, height=400, background_color='white').generate(text)

plt.figure(figsize=(10, 5))
plt.imshow(wordcloud, interpolation='bilinear')
plt.axis("off")
plt.show()


# --------------------------------------------------------------------------------- */

## 워드클라우드 - 특정 단어 제외

df = pd.read_csv('DATASET.csv')

df_pos = df[df.label == 'POSITIVE']
df_neg = df[df.label == 'NEGATIVE']

text_pos = " ".join(df_pos['Review'].astype(str))
text_neg = " ".join(df_neg['Review'].astype(str))

# 특정 단어 제외
rm_words = set(STOPWORDS)
rm_words.update(['music', 'app', 'song', 'songs', 'listen', 'Spotify'])

wordcloud_pos = WordCloud(width=800,
                          height=400,
                          background_color='white',
                          stopwords=rm_words).generate(text_pos)

wordcloud_neg = WordCloud(width=800,
                          height=400,
                          background_color='black',
                          stopwords=rm_words).generate(text_neg)

fig, axes = plt.subplots(1, 2, figsize=(20, 10))
fig.subplots_adjust(wspace=0)

# 긍정 워드클라우드
axes[0].imshow(wordcloud_pos, interpolation='bilinear')
axes[0].axis("off")
axes[0].set_title('Positive Reviews', fontsize=20, fontweight='bold')

# 부정 워드클라우드
axes[1].imshow(wordcloud_neg, interpolation='bilinear')
axes[1].axis("off")
axes[1].set_title('Negative Reviews', fontsize=20, fontweight='bold')

plt.axis("off")
plt.show()
'Python' 카테고리의 다른 글
| [파이썬] 모듈화를 활용한 함수 호출, 재사용성 증가 (4) | 2024.11.08 |
|---|---|
| [파이썬] plotly를 활용한 막대그래프 - plotly.express (3) | 2024.11.07 |
| [파이썬] CCTV 이미지를 활용한 이미지 객체 탐지 - 박스 표시, yolov5 (4) | 2024.10.22 |
| [파이썬] 데이터프레임 형태 변환 - pandas, melt (2) | 2024.10.21 |
| [파이썬] 데이터 집계 및 요약 - pandas, pivot_table, aggfunc (2) | 2024.10.14 |