matplotlib을 활용한 지식 그래프 Knowledge Graph 시각화
들어가며
지식 노드 그래프 Knowledge Node Graph, 일반적으로 지식 그래프 Knowledge Graph는 현실의 다양한 사물들과 그 관계를 노드(Node)와 엣지(Edge)로 표현한 구조화된 데이터 모델입니다. 즉, 사물들 간의 관계를 시각적으로 표현한 그래프입니다.
지식 그래프 | "무엇이 무엇과 어떤 관계를 맺고 있는지"를 컴퓨터가 이해할 수 있도록 시각적으로 표현한 지식의 연결망
이 글에서는 지식 그래프에 대한 개념과 구성요소 그리고 파이썬을 활용하여 지식 그래프를 시각화하는 방법을 소개합니다. 시각화는 방향의 유무, 속성의 유무로 분류하여 소개합니다.
지식 그래프의 구성 요소
지식 그래프의 구성 요소는 다음과 같이 3가지로 구성됩니다.
| 구성 요소 | 설명 | 예시 |
| 노드 Node | 객체 Entity | 사람, 장소, 사물, 개념 등 | 사과, 빨강, 과일 |
| 엣지 Edge | 노드 간 의 관계를 나타내는 선 | 사과 → 과일(사과는 과일이다) |
| 속성 Property | 노드나 엣지가 갖는 부가 정보 | 사과 → 색상(빨강), 포도 → 계절(가을) |
지식 그래프가 중요한 이유
전통적인 RDS 데이터베이스는 행과 열로만 정보를 저장하기 때문에 개체 간 관계를 표현하기에 한계가 있습니다. 하지만, 지식 그래프는 정보 간 의미론적 관계를 명시적으로 드러내므로 컴퓨터가 정보를 더 사람처럼 이해하고 연결할 수 있습니다.
예를 들어, "비타민C 가 풍부한 과일은 뭐야?"라는 질문이 입력됐을 때, 지식 그래프에서는 사과 → 비타민C, 오렌지 → 비타민C 라는 연결이 있기 때문에, 즉각적으로 '사과'와 '오렌지'를 출력할 수 있습니다.

지식 그래프 베이스 코드
지식 그래프는 크게 방향의 유무에 따라 무방향 그래프, 방향 그래프로 분류할 수 있습니다. 지식 그래프에 필요한 패키지를 import하고, 시각화에 필요한 베이스 코드를 소개합니다.
import networkx as nx
import matplotlib.pyplot as plt
무방향 그래프
무방향 그래프에 대한 베이스 코드는 다음과 같습니다. nx.Graph()는 무방향 그래프를 생성합니다. 그래프 객체인 G에 'apple'과 'red' 노드를 생성함을 의미합니다.
G = nx.Graph()
G.add_edge("apple", "red")
위의 베이스 코드를 활용하여 matplotlib으로 그래프를 시각화하겠습니다.
import networkx as nx
import matplotlib.pyplot as plt

G = nx.Graph()
G.add_edge("apple", "red")

pos = nx.spring_layout(G)  # 노드 배치 자동 조정
nx.draw(G,
        pos,
        with_labels=True,
        node_color='lightblue',
        edge_color='gray',
        node_size=2000,
        font_size=16)

plt.show()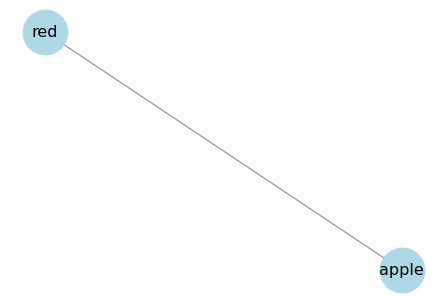
무방향 그래프 + 속성
위의 베이스 코드를 활용하여 속성을 추가한 무방향 그래프를 시각화하겠습니다. add_edge에서 relation 속성을 추가하고, draw_networkx_edge_labels를 활용하여 시각화합니다.
import networkx as nx
import matplotlib.pyplot as plt

G = nx.Graph()
G.add_edge("apple", "red", relation="color")  # relation 추가

pos = nx.spring_layout(G)  # 노드 배치 자동 조정
nx.draw(G,
        pos,
        with_labels=True,
        node_color='lightblue',
        edge_color='gray',
        node_size=2000,
        font_size=16)

edge_labels = nx.get_edge_attributes(G, 'relation')
nx.draw_networkx_edge_labels(G, pos, edge_labels=edge_labels, font_color='blue', font_size=12)

plt.show()
방향 그래프
방향 그래프에 대한 베이스 코드는 다음과 같습니다. nx.DiGraph()는 방향 그래프를 생성합니다. 그래프 객체인 G에 'apple'이라는 노드에서 'red'라는 노드로 방향이 있는 엣지를 추가하는 코드입니다. 여기서 주의할 점은 노드 간의 연결이 한 방향임을 의미한다는 것입니다. 즉, 'red → apple'이 아닌 'apple → red'를 의미합니다.
G = nx.DiGraph()
G.add_edge("apple", "red") # apple -> red
위의 베이스 코드를 활용하여 matplotlib으로 그래프를 시각화하겠습니다.
import networkx as nx
import matplotlib.pyplot as plt

G = nx.DiGraph()
G.add_edge("apple", "red") # apple -> red

pos = nx.spring_layout(G)  # 노드 배치 자동 조정
nx.draw(G,
        pos,
        with_labels=True,
        node_color='lightcoral',
        edge_color='gray',
        node_size=2000,
        font_size=16)

plt.show()
방향 그래프 + 속성
위의 베이스 코드를 활용하여 속성을 추가한 방향 그래프를 시각화하겠습니다. add_edge에서 relation 속성을 추가하고, draw_networkx_edge_labels를 활용하여 시각화합니다.
import networkx as nx
import matplotlib.pyplot as plt

G = nx.DiGraph()
G.add_edge("apple", "red", relation="color")  # relation 추가

pos = nx.spring_layout(G)  # 노드 배치 자동 조정
nx.draw(G,
        pos,
        with_labels=True,
        node_color='lightcoral',
        edge_color='gray',
        node_size=2000,
        font_size=16)

edge_labels = nx.get_edge_attributes(G, 'relation')
nx.draw_networkx_edge_labels(G, pos, edge_labels=edge_labels, font_color='blue', font_size=12)

plt.show()
지식 그래프의 확장
2개의 노드가 아닌 여러 개의 노드로 확장된 복잡한 구조도 가능합니다.
과일/채소에 대한 데이터를 fruit_knowledge에 저장하고, 그래프 객체인 G에 노드를 추가합니다. 과일/채소는 lightcoral 색상, 속성은 lightgreen 색상, 그 외는 gray 색상을 설정합니다.
import networkx as nx
import matplotlib.pyplot as plt

fruit_knowledge = {
    "apple": ["fruit", "red", "sweet", "vitamin_c", "fall"],
    "banana": ["fruit", "yellow", "sweet", "tropical"],
    "orange": ["fruit", "orange", "citrus", "vitamin_c"],
    "strawberry": ["fruit", "red", "small", "sweet", "spring"],
    "watermelon": ["fruit", "green", "red", "large", "summer"],
    "pineapple": ["fruit", "yellow", "tropical", "sweet", "hard_skin"],
    "blueberry": ["fruit", "blue", "small", "antioxidant"],
    "kiwi": ["fruit", "brown", "green", "vitamin_c", "tart"],
    "peach": ["fruit", "pink", "sweet", "summer"],
    "lemon": ["fruit", "yellow", "sour", "citrus"],
    "mango": ["fruit", "orange", "tropical", "sweet", "vitamin_a"],
    "cherry": ["fruit", "red", "small", "sweet", "summer"],
    "pear": ["fruit", "green", "sweet", "crunchy"],
    "plum": ["fruit", "purple", "tart", "stone_fruit"],
    "carrot": ["vegetable", "orange", "crunchy", "vitamin_a", "root"],
    "broccoli": ["vegetable", "green", "fibrous", "health", "cancer_fighting"],
    "spinach": ["vegetable", "green", "leafy", "iron", "health"],
    "cucumber": ["vegetable", "green", "crunchy", "hydration", "summer"],
    "potato": ["vegetable", "brown", "starchy", "root", "versatile"]
}


G = nx.DiGraph()
attributes_set = set()

# 노드 추가
for item, attributes in fruit_knowledge.items():
    for attr in attributes:
        G.add_edge(item, attr)
        attributes_set.add(attr)

# 색상 설정
node_colors = []
for node in G.nodes():
    if node in fruit_knowledge:  # 과일/채소 이름
        node_colors.append('lightcoral')  # 과일/채소는 lightcoral
    elif node in attributes_set:
        node_colors.append('lightgreen')  # 속성은 lightgreen
    else:
        node_colors.append('gray')  # 예외


pos = nx.spring_layout(G)  # 노드 배치 자동 조정
plt.figure(figsize=(12, 10))
nx.draw(
    G,
    pos,
    with_labels=True,
    node_color=node_colors,
    edge_color='gray',
    node_size=2000,
    font_size=11,
    arrows=True
)

plt.show()
'Python' 카테고리의 다른 글
| [파이썬] 파이썬을 활용한 좌표 변환 - pyproj (4) | 2025.04.20 |
|---|---|
| [파이썬] 지진 데이터 지도 시각화 - 히트맵, 클러스터링, folium (6) | 2025.04.17 |
| [파이썬] 지도 시각화 - folium, 마커 표시 (4) | 2025.04.14 |
| [파이썬] .env 파일 활용 - API KEY 관리 및 개인 정보 보호 (4) | 2025.04.13 |
| [파이썬] 소수점 반올림, 올림, 내림 - numpy, math (2) | 2025.04.12 |